Whitepaper - Prescribing a Hearing Aid to a Patient Using Machine Learning
Introduction
Modern hearing instruments contain data-logging technology to record data separate from the audio stream. Data-logging feature has been available with hearing aid manufacturers for some time now. Over time the way the data is utilized and portrayed to the clinician has evolved. Data processing differs for each manufacturer. Combined with the details of patient, such as the audiogram, the variety of data generated is very useful in counselling, fine tuning and troubleshooting. However, success of the result depends on specialist’s experience and gradual (based on data availability).

These days there are some advance hearing aids that have self-learning capabilities such as making changes in the programs, volume controls and microphone sensitivity based on the changes made by the user in certain acoustic environments. Logged data and in-built AI make these devices a more comfortable experience for the users.
However, if we can devise a scientific methodology that uses patients logged data, performance data for specific settings, and help clinician in
- prescribing a hearing aid to a patient,
- identifying factors that would influence the choice of one hearing aid over another (say ITE or BTE),
- and assessing its performance over time,
then it would help patients significantly as their problem would get addressed in more timely manner and with lesser cost.
Proposed Solution
“Data Mining” also known as Knowledge Discovery in Databases (KDD), refers to the nontrivial extraction of implicit, previously unknown and potentially useful information from the data stored in databases.
KDD can be used to extract meaning from data generated by the Audiology devices, expressly looking for patterns that not only link historic observations but also predict future behavior. Below are the process, techniques, and interpretation of data mining, with specific focus on problems stated above.
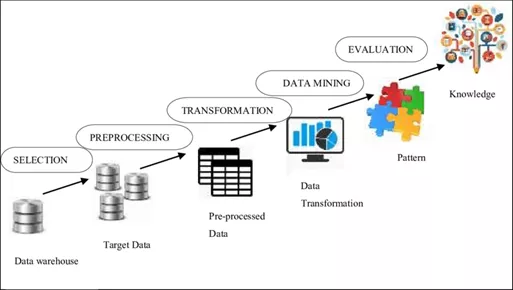
1. Preprocessing
The data collected can be noisy or anomalous in a multitude of ways. Missing, wrong, or unreliable data come from consideration of measurements of an audiogram. Even with a complete audiogram, that has no missing values, one may doubt the veracity of some or all of the recorded values. This could be for several reasons, such as a nonorganic hearing loss, operator error, or the audiogram values being deliberately adjusted from their true value for purposes best known to the clinician.
A second source of doubt could arise in the velocity recorded in a data set. Successive visits of a device to a clinic may prompt a repeat measure of the audiogram, thereby creating a time series of audiograms. Large changes recorded between successive visits may have a valid explanation, such as a fluctuating hearing loss. However, the pattern of changes may also indicate that the device has been loaned temporarily at different times to multiple wearers.
2. Transformation: z-score transform
Although transformation can take many forms, such as arithmetic manipulation of data values, a general aim in its use could be to ensure that any one data dimension/feature does not dominate, thereby introducing a bias to the results.
In data mining, a common transformation is to scale the data features so that, within each data type, statistically they have a mean of zero and variance of unity, using what is known as the z-score transform.
3. Data Mining-Clustering: Using K Means
It is an unsupervised learning task to identify meaningful groupings of the data into classes that are not known beforehand but instead are learned from the data. With clustering, points in the data set are grouped such that points within a given group are similar to each other in some sense than the points outside of the group. Such exploratory data mining is useful as it may help uncover common profiles of hearing or lifestyle.
Audiograms can be clustered so that audiograms of similar shape are clubbed into the same group. These learned clusters can often give a more informative, high-level view about the composition of the users. In addition, such clustering may promote selection of a device tailored to better fit common profiles. E.g. reverse slope when compared with presbycusis audiograms.
4. Data Mining-Subgroup Discovery: Using Chi-Square Test
The aim of this subgroup discovery is to search for interesting subgroups within the data set for some predetermined notion of interestingness. A practical translation is: “Are there patterns of behavior (i.e., interrelationships in the data) that are far more, or far less, common or occur by chance.” By adjusting for the size of data subsets, we ensure that no part of the data set have an overrepresentation in any patterns found.
5. Data Mining-Classification: using Random Forest
Classification is a supervised learning task. In contrast to clustering, meaningful groupings of the data are known a priori and are provided as labels. The task is to be able to accurately predict the labels, given the data. There may be a fixed number of styles of device available (completely-in-the-canal, in-the-ear, behind-the-ear, etc.), and the most basic data consist of the audiograms for users of these devices. For existing users, we know which style of device the user has, and so we can analyze to see whether specific audiogram patterns are associated with each style of device. A simplistic task would then be to build a classification model to predict which style is most likely to be suitable for a new user on the basis of their audiogram alone.
A Random Forest employs multiple decision trees. Each decision tree functions as a classifier, or regressor, based on rules expressed within a tree-like structure; the branch structure develops as a product of the dimensions available from obeying each of a string of rules.
The final decision of the branching is represented by a leaf. Therefore, the decision from a Random Forest analysis is the aggregated decision of all the individual trees within the forest and so represents a “best of multiple estimates” rather than just a single estimate from the available data. The structure of each tree in the forest is defined by the results generated from a set of training data via bagging. Bagging is a procedure of sampling with replacement from the training set.
6. Data Mining-Regression: Using Gaussian Process Regression
Regression is like classification except that the labels are not categorical but instead are continuous real valued. Whereas classification is appropriate for predicting the type of device (behind-the-ear, completely-in-the-canal, etc.), regression is an appropriate method for predicting the absolute threshold for a given audiogram frequency.
Gaussian processes are a popular model that can be used for both classification and regression tasks. They are a probabilistic model, and so one of their great strengths is in quantifying uncertainty. That is, not only will the model provide a prediction, but it can also provide a measure of confidence in the prediction.
7. Evaluation/Interpretation - Using N-fold cross-validation
For a task such as classification or regression, the objective is the predictive power of the learned model on new instances of data. A model that does not generalize to being able to obtain sensible predictions from new data, but models only the training data, is called “overfitted” and is comparatively useless.
The performance of a model should therefore be evaluated on data that are separate to the data used to train or update the model. The estimated performance of the model based on the training data will be overconfident because the model can be adapted to fit the seen data specifically and hence may over fit the data. To make efficient use of the data available, while obtaining a less biased estimate of performance, we can use a procedure called N-fold cross-validation.
A number of folds, N, are selected (a common choice of N is 10) in order to partition the data into N separate subsamples by use of “folds,” divisions of the data set. For each of N models to be trained, one subsample, delimited by the fold boundaries, is retained for testing of the model, while the remaining N−1 subsamples are used to train the same model.
This will produce N unbiased estimates of performance. If estimates of performance derived from the training data are high while the testing estimates are low, then the model has overfit the data and has not generalized well.
Benefit to Clinician: Detecting Abnormal Device Behavior
From the dataset we can deduce of either a failed fitting or abnormal behavior of the device. We can model the data dimension as a function of the fraction of time, the device was in its directional mode. We can expect that as the mean input dB SPL (Sound Pressure Level) increases, representing a noisier environment, the device would spend more time in a directional rather than an omnidirectional mode. We should not be privy to the exact internal workings of the device, instead expect that the decision to use the directional mode may also be influenced by the acoustic environment classifier, not just the Input SPL.
Our assumption in this analysis is that there exists a solid link between the directionality and the input SPL and may not hold in all circumstances. The in-ear styles of hearing aid do not have directional microphones, so the focus was on a style that does. The relationship between input dB SPL and the time in directional mode can be modeled as a regression using a Gaussian process.
By knowing the mean and variance of the process describing the data, we can set boundaries outside of which the existence of a data point can be regarded as rare, possibly indicating abnormal behavior.
The device performance can also be measured in terms of hardware performance like batteries, microphones. After patient use the device for a period, the quality of the hardware decreases resulting in poor performance. This can be traced by using time series plots which shows the performance of the device.
Conclusion
The models act as part of a decision support system for prescribing or identifying the category of hearing aids for patient with different hearing difficulties. The model also answers the factors/dimensions which drive the choice of hearing aids one over other. The model also answers the question about the performance of the device after using for a certain period which can help in making decisions about the hardware changes if required any in the device. The models can be developed/trained and evaluated on a large set of patient records.
Transform patient care now! Connect with us to explore the future of audiology through advanced Machine Learning.
Discover more